Estimating the economic value of trade in CITES species can strengthen the case for incentive driven management and sustainable use by making the contribution to national economies and livelihoods more explicit. The monetary value of EU imports and exports of CITES-listed animal species is estimated in this section. To calculate the value of relevant 2013 imports to the EU, we use a methodology first developed by UNEP-WCMC for the 2010 Analysis and also used for the 2011 and 2012 Analyses.
The value of EU imports of CITES-listed animals in 2013 (excluding caviar extract) was estimated at USD634 million (~EUR582 million), whereas the value of EU exports (including re-exports) was estimated more than double that value; approximately USD1.5 billion (~EUR1.4 billion). The most valuable import commodities were leather products and skins; luxury items also made up a high proportion of export value, including leather products, garments and caviar. In the CITES context, trade in wild and ranched CITES-listed animals to the EU in 2013 was likely to be economically important for the top ten exporters by value (estimated to be over USD2 million each). Five of these countries are “megadiversity” countries.
Methodology
To estimate the value of EU trade in CITES-listed animals, species-specific values in United States dollars (USD) that are included in the United States annual report to CITES (as transmitted by the United States Fish and Wildlife Service)[1] were used for calculations. The median value for each family/term/unit/source combination, corrected for inflation, was multiplied by the corresponding EU-reported trade volume (as recorded in the CITES Trade Database) to obtain a total value for CITES-listed EU imports and exports in 2013. In cases where there was an insufficient sample size to calculate a reliable value for the family/term/unit/source combination, a suitable proxy was used (e.g. order instead of family, or an alternative term or source); in cases where no suitable proxy could be found, the data were excluded.
Whilst the exclusion of some trade records will reduce the overall estimated value of EU trade, other median values that are high but are based on a lower number of records (e.g. five to ten) may have the effect of exaggerating the value importance of certain taxa. Overall figures should therefore be interpreted with some caution. Further details of the methodology, along with caveats to this approach, are found here.
Results are initially presented exclusive of caviar extract as value estimates for this commodity may be inflated. Whilst prices for caviar extract are based on a high number of records in the United States dataset, it is unclear if the quantities reported in trade accurately represent the amount of CITES-listed extract within finished skincare products.
A comprehensive valuation of EU plant imports was not undertaken as no value dataset with adequate taxonomic coverage was available at the time of analysis.
[1] Reflecting the amounts reported by traders via USFWS 3-177 forms.
Total import value, excluding caviar extract
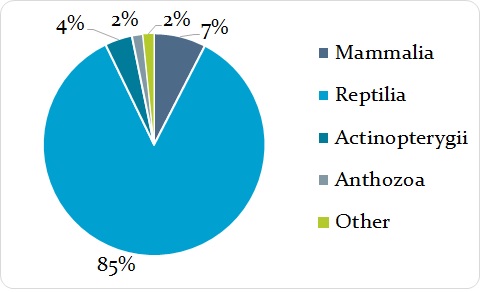
The monetary value of EU reported CITES-listed animal imports in 2013, excluding caviar extract, is estimated to be approximately USD634.2 million (or ~ EUR 582 million[1]). The value of this trade appears to have decreased when compared to estimates of the previous two years (USD686 million and USD738 million, respectively)[2]. As in previous years, the value was dominated by reptile commodities, with trade in reptiles accounting for 85% of the value of EU animal imports in 2013, reflecting the relatively high volume of EU imports of this group (Figure 5.1). Trade in wild and ranched CITES-listed animals imported into the EU in 2013 accounted for USD454 million (~EUR417 million) or 72% of total estimated value, and increased based on 2012 estimates of USD431 million. In contrast, captive-produced imports declined based on 2012 estimated values; they were worth over USD174 million (~EUR160 million, or 27% of value) in 2013 compared with USD279 million in 2012 (a decline of around 38%).
[1] All Euro equivalent values throughout this section are based on an exchange rate of 0.91 EUR to 1 USD from http://www.xe.com/ on 06 August 2015.
[2] When comparisons to 2012 prices are used, these reflect values published in the 2012 EU Analysis of Annual Reports that are based on the same methodology used here, but use the median 2012 USD equivalent value from 2008-2012, as opposed to the 2013 USD value derived from the median of 2009-2013 United States price data. Similarly, 2011 prices are based on median values using the 2007-2011 United States price data. Annual figures for 2011 and 2012 have been corrected for inflation.
Key Commodities imported by the EU by value
Leather products and skins were the top two commodities imported by value when excluding caviar extract, representing 50% and 34% of the overall estimated value, respectively. This mirrors findings from previous years (2010, 2011 and 2012). However in 2013, skins and live animals were the top commodities imported to the EU by volume (35% and 27% of the trade recorded as number of items, i.e. without a unit, respectively), with leather products imported in the third largest volume (or 26% of trade reported). The value of the key commodities imported by the EU in 2013 is summarised in Figure 5.2. A brief overview of the top commodities based on value (leather products, skins, live animals and caviar), is provided below.
Leather products
Leather products (encompassing both small and large leather products) represented the most valuable commodity imported into the EU in 2013 (excluding caviar extract) with an estimated value of USD318 million (~EUR292 million). Correcting for inflation, this represents a small increase in value of around 2% compared with 2012. Just over one million leather products were imported to the EU in 2013.
The predominant families in trade by economic value were reptilian. Alligatoridae accounted for 74% of the EU imports of this commodity by value; Crocodylidae (11%) and Pythonidae (8%) also represented a notable proportion of estimated economic value. Wild-sourced leather products accounted for 80% of the total value of leather products (USD256.5 million or ~EUR236 million), again primarily comprising the family Alligatoridae (88% of all wild-sourced leather products).
Skins
Skins were the second highest commodity imported by value into the EU in 2013 (excluding caviar extract) and the top commodity imported by volume (>1.3 million skins). This trade was estimated to be worth over USD213 million (~EUR195 million), with reptiles representing the majority of the estimated value (93%) and mammals comprising the remainder. The estimated value of skin imports in 2013 was around 7% lower than the value estimated for 2012 skin imports, corrected for inflation. However, the trade in skin pieces was estimated to be worth an additional USD1.19 million (~EUR1.09 million); an increase of around 49% compared with the 2012 estimate.
The three most important reptile families by estimated economic value for the skin trade in 2013 were: Alligatoridae (52%), Pythonidae (26%) and Crocodylidae (19%). Over 80% of the reptile skin trade by value was dominated by only four species, in order of importance: Alligator mississippiensis, Crocodylus niloticus, Python bivittatus, and P. reticulatus.
Almost 60% of all reptile skin imports by value were wild sourced, and this trade was estimated to be worth USD116 million (~EUR106 million), mainly comprising Alligatoridae. Around a third of the value of reptile skin imports was derived from captive sources (comprising mainly Pythonidae and Crocodylidae) and were estimated to be worth USD64 million (~EUR59 million), with ranched skins (virtually all Crocodylidae) worth approximately USD18 million (~EUR16.5 million). The price of skins in trade was affected by the source of the specimens; the median value for wild-sourced Alligatoridae skins (USD237) was over three times the value of captive-produced skins (USD68) and almost six times the value of ranched skins (USD40). These prices were based on a high number of trade records for wild-sourced, captive-sourced and ranched skins (1829, 787 and 62 respectively).
The value of mammal skin imports to the EU in 2013 was estimated at USD15.2 million (~EUR13.9 million). The most important families by economic value were Felidae (65%) and Canidae (29%).
Live animals
Live animals represented the third most valuable commodity in 2013, and was the second highest commodity imported by quantity in 2013 (reported in number of units) with over one million individual animals imported. The total estimated value of live animal imports into the EU in 2013 was over USD28million (~EUR25.7 million), representing an increase of around 15% compared with 2012 estimated values. However, the estimated economic value of this trade remains around 25% lower than estimates for 2011 (USD37.8 million corrected for inflation).
Whilst corals (Anthozoa), reptiles and leeches (Hirudinoidea) dominated EU live imports as reported by quantity (number) in 2013, with 53%, 31% and 10% of the trade respectively, live mammals accounted for the highest proportion of the trade by value (39% or USD10.8 million, ~EUR9.9 million). (Figure 5.3). The approximate average value for a live mammal imported in 2013 (based on estimated family median values[1]) was over USD2500, compared to around USD5-6 for a live animal of the families Hirudinoidea and Anthozoa, or USD29 for Reptilia (Table 5.2).
As in all previous years (2010, 2011 and 2012), Cercopithecidae was the predominant mammal family imported by value, accounting for 97% of the value attributed to live mammals. Trade was dominated by one species: Macaca fascicularis, mainly for biomedical purposes (83%). The majority of the economic value of live mammals was derived from captive-bred specimens (>99%).
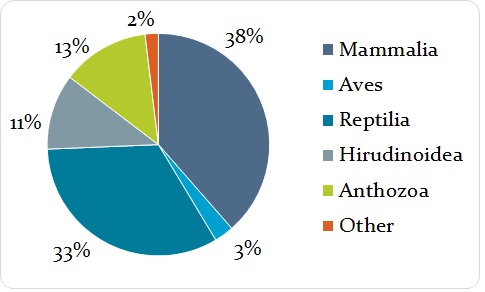
Proportion of EU value (2013 USD) of imports of live animals by class in 2013. (‘Other’ includes Amphibia, Actinopterygii, Bivalvia, Arachnida, Insecta and Hydrozoa.)
Trade in live reptiles accounted for 33% of live imports by value in 2013, and was valued at approximately USD9.3 million (~EUR8.5 million). The key reptile families in live trade, in order of estimated value, were: Geoemydidae (47%), Testudinidae (23%), and Pythonidae (18%). The majority of trade in Geoemydidae was in two species: Mauremys reevesii and M. sinensis. The majority of the economic value in live reptiles was derived from captive-bred specimens (86%).
Although the relative value of an individual live bird imported to the EU appears to be comparatively high (Table 5.1), trade volumes are low (<1000). The overall value of live bird imports in 2013 accounted for almost USD0.8 million (~EUR0.73 million) or around 3% of the estimated value of EU imports of live animals. The majority of the value can be attributed to birds from captive sources (95%), with the majority of the remainder derived from wild-sourced birds. Over half of the estimated value of live bird imports in 2013 could be attributed to falcons (predominantly Falco rusticolus and F. peregrinus).
The total value of EU imports of live invertebrates was estimated at USD6.9 million or ~EUR6.3 million). Just over half of this value was derived from corals of the class Anthozoa (173 taxa), with almost 45% of the value from two species of the class Hirudinoidea (Hirudo medicinalis and H. verbena). Around half of the value for live corals (52%) and three-quarters of the leeches (77%) were derived from wild-sourced specimens.
Average value of live animals imported by the EU in 2013, by class (nearest USD).
| Class | Average value in USD of live animals (reported in number) by class (using estimated median family values) | Approximate EUR equivalent (nearest EUR) |
|---|---|---|
| Mammalia | 2580 | 2363 |
| Aves | 1013 | 928 |
| Reptilia | 29 | 27 |
| Amphibia | 33 | 30 |
| Bivalvia | 9 | 8 |
| Anthozoa | 6 | 5.5 |
| Hirudinoidea | 5 | 4.5 |
| Hydrozoa | 4 | 3.6 |
| Actinopterygii | 4 | 3.6 |
| Insecta | 2 | 1.8 |
| Arachnida | 1 | 0.9 |
Caviar
Caviar was the fourth most important commodity by value imported in 2013. Imports of caviar into the EU were estimated to be worth USD24.7 million (~EUR22.7 million) in 2013; representing a decline of 76% compared with the 2012 estimate (USD103.5 million) corrected for inflation.
Over 98% of the value of caviar was derived from aquaculture (sources C and F) specimens. This reflects trade volumes, with over 95% of caviar (reported in kg) originating from captive sources. The main captive-bred taxa imported by value were Huso dauricus x Acipenser schrenckii (25%), Acipenseridae spp. (16%) and A. gueldenstaetii (16%).
Caviar is a very low volume but high value product. The median values[1] for captive-bred caviar for combined species of the family Aciperseridae have declined slightly for the years 2010, 2011, 2012 and 2013 in which valuation analysis has been undertaken; USD998/kg, USD969/kg, USD912/kg and USD856/kg, respectively (corrected for inflation). Comparatively, the median family value for wild-sourced caviar has declined more rapidly over the equivalent years; USD1153/kg, USD913/kg, USD705 and USD447/kg, respectively (corrected for inflation). Only wild-sourced caviar of Polyodon spathula was imported in 2013.
Valuation of plant trade
For the majority of plant species, the United States dataset did not have any value information that was comparable to the animal value data applied and there is no existing centralised dataset for global plant price data. Efforts continue to acquire more comprehensive price data for CITES-listed plants.
[1] Total 2013 import value based on family median value by class, divided by the number of animals imported in 2013 by class.
[2] Based on the five most recent years of value data
Value of caviar extract
As in previous years, caviar extract represented the main commodity in trade by value in 2013, amounting to USD3.87 billion[1] (~EUR3.55 billion). This commodity is imported in very small quantities, and is used in cosmetics, luxury moisturising creams and skincare preparations for its purported anti-aging properties. According to the United States Customs data, the estimated value of one kilogram of caviar extract is USD19 million (~EUR17.4 million) or USD19 000 per gram. This is based on the median value of 513 records within the United States Customs dataset, spanning five years (2009-2013) and involving both United States imports and exports. It is unclear whether the declared prices in the United States dataset represent the actual price for the extract in its natural form or whether this value represents the luxury commodity that contains the extract; however, caviar extract is known to be traded internationally in both forms.
In total, over 200 kg of extract were imported by the EU in 2013, mainly from Acipenser baerii (Table 5.2). Virtually all extract (99.9%) originated from captive-bred or captive-born sources, with the remainder of an unreported source. Switzerland was the main EU trading partner accounting for virtually all EU imports; however the majority of this extract (97%) originated from France.
Quantity and estimated value of caviar extract (in kg) imported by the EU in 2013 (rounded to two decimal places, where applicable).
| [l]Taxon | Quantity (kg) | Estimated Value (Millions of USD, rounded to the nearest million) | % of extract value |
|---|---|---|---|
| [l][i]Acipenser baerii[/i] | 198.09 | 3779 | 97.50% |
| [l][i]Acipenser[/i] hybrid | 2.84 | 54 | 1.40% |
| [l][i]Acipenser gueldenstaedtii[/i] | 2.24 | 43 | 1.10% |
| [l]Total | 203.17 | USD3875 |
[1]“Billion” in this report is used to refer to 109.
Value by trading partner
Based on importer-reported trade volumes and estimated commodity values, Switzerland was considered the main trading partner by economic value in 2013, as in the previous year, with imports from the country estimated to be worth approximately USD164 million or ~EUR150 million (animal commodities only, excluding caviar extract). The estimated value of animal commodities from the country had declined by over 30% based on 2012 estimates (USD238 million, corrected for inflation). Trade with a further five countries was estimated to be worth between USD45 million-USD85 million each (USA, Tunisia, Singapore, China and Mauritius), with the overall import value from all other individual trading partners being worth less than 3% each (Figure 5.4).
Considering the live animal trade only, the key trading partners by value were Mauritius (28%), China (18%), Turkey (10%) and Indonesia (9%). This is in contrast to the live animal trade by volume in 2013, where Indonesia, Australia and the Russian Federation were the main EU trading partners, with imports of over 100,000 live animals from each.
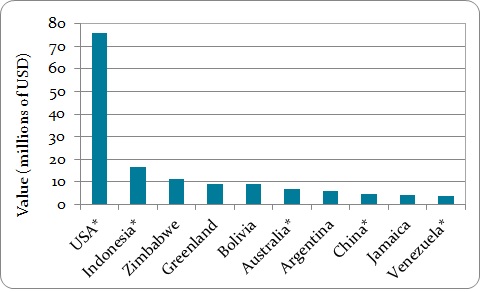
Of the wild-sourced and ranched trade imported directly to the EU in 2013 (totalling USD166.8 million or ~EUR153 million), the top ten export countries accounted for 88% of the estimated overall value of imports (Figure 5.5). These countries, and their relative order in terms of the economic importance of trade with the EU were virtually the same as in 2012. There were two exceptions; Zimbabwe was ranked third in 2013 and previously did not appear in the 2012 top ten; Peru did not appear in the 2013 highest list. The vast majority of the estimated value of the trade with Zimbabwe in 2013 (98%) is attributed to trade in Crocodylus niloticus.
In the CITES context, this trade is likely to be economically important to these countries. Five of these countries are one of the 17 “megadiversity” countries [1], three of which have over 1000 CITES-listed animal species; United States (1097), Indonesia (1460) and Australia (1061).
However, whilst the EU imported over 100 different taxa from coral-rich Indonesia and Australia in 2013 (with corals representing 8% and 10% of CITES-listed animal taxa within these countries respectively), estimated total values from the remaining “top ten” countries could be attributed to ≤ 20 taxa. Bolivia, and Venezuela each exported only one wild-sourced or ranched species to the EU in 2013 (Caiman crocodilus), as did Jamaica (Strombus gigas). Whilst Greenland has relatively few CITES-listed animal species (35), over 40% of these were imported by the EU in 2013.
Two reptile species accounted for 33% of the overall value of captive-bred trade imported directly by the EU in 2013: Python bivittatus and Crocodylus niloticus. Around 28% of the estimated value of captive-bred trade was from China. Other notable trading partners for captive-bred imports by value were Viet Nam (20%), Mauritius (9%) and South Africa (7%). Relatively few taxa accounted for this value Viet Nam (12), and Mauritius (5); whilst EU imports of 43 taxa originated in South Africa, almost 97% of estimated value was derived from Crocodylus niloticus.
[1] Mittermeier, R.A., Gil P.R. and Mittermeier, C.G. (1997) Megadiversity: Earth’s Biologically Wealthiest Nations. Conservation International, Cemex.
This section analyses the value of both direct and indirect exports; hereafter, ‘exports’ refers to both direct exports and re-exports, unless otherwise specified.
Total export value, excluding caviar extract
The monetary value of EU-reported CITES-listed animal exports in 2013, excluding caviar extract, is estimated to be approximately USD1.5 billion (1 506 896 434, ~ EUR1.37 billion). This is around 19% higher than the estimated value of exports in 2012 (USD1.26 billion, corrected for inflation), and is more than double the estimated value of imports to the EU in 2013.
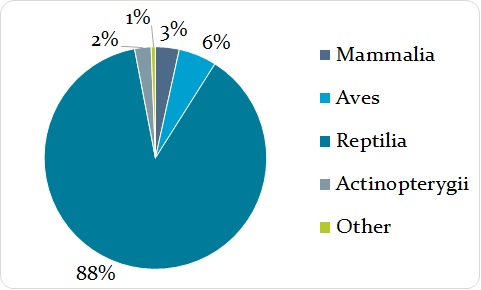
Reflecting high volumes of reptile exports in 2013, this group accounted for 88% of the overall value of exports (USD1.3 billion ~ EUR1.19 billion; Figure 5.6). Whilst the estimated economic value of birds imported into the EU is relatively small (Figure 5.1), the value of exports of birds and their parts and derivatives was worth over USD83 million (~EUR76 million) in 2013. EU exports of wild-sourced and ranched CITES-listed animals in 2013 accounted for USD908 million (or ~EUR833 million; 60% of total estimated value); this represented an increase of around 34% compared with 2012 estimates (USD676 million). Captive-produced exports in 2013 were worth over USD580 million (~EUR532 million, or 39%).
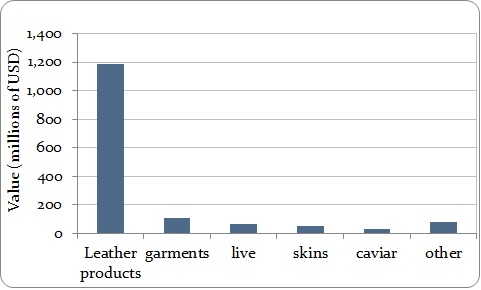
Key commodities exported by the EU by value
The proportional value of key commodities exported by the EU in 2013 is summarised in Figure 5.7. As for EU imports, leather products (encompassing both small and large leather products) were the top commodity exported, by value. The overall value of exports was largely comprised of luxury items: leather products (79%), garments (7%) and caviar (2%). A brief overview of the top export commodities is provided below. In 2012, the top commodities were similar, although exports of live animals were estimated to be of a slightly higher value than exports of garments. As in 2012, the top three destinations for EU exports by overall value in 2013 were: Switzerland (39%), China (15%) and United States (13%).
Leather products
Leather products were the most valuable commodities exported by the EU in 2013, worth an estimated USD1.18 billion (~EUR1.08 billion). The value of this commodity increased by 24% based on estimated figures for 2012. As a comparison, exports of leather products were worth more than 3.5 times the value of imports of this commodity.
The EU leather industry creates high-added-value products in the fashion, furniture and automotive sectors. The EU itself is the main consumer of the leather it produces, absorbing two-thirds of leather sales[1]. The total annual export value of CITES-listed leather products manufactured in the EU is therefore likely to be substantially higher. The main EU exporters of CITES-listed leather products by estimated value were Italy (45%) and France (33%). The top import destinations (according to highest estimated value) were Switzerland (46%), China (16%) and the United States (13%).
Garments, skins and caviar
Garments were the second most valuable commodity exported from the EU in 2013, accounting for 7% of export value, worth an estimated USD108 million (~EUR99 million). This represents an increase of 39% based on 2012 estimates (USD78.9 million, corrected for inflation). The majority of estimated value was derived from Crocodylidae (37%), Alligatoridae (20%) and Felidae (15%). Total export value was higher for wild-sourced garments (USD58 million, ~EUR53 million) than for garments from captive-produced specimens (USD27 million, ~EUR24.8 million). For Crocodylidae, the median price for a captive-produced garment (USD2690, based on 174 price records) was around a third higher than the price for a wild-sourced garment (USD1809, based on 112 price records).
EU exports of skins in 2013 were worth an estimated USD47.8 million (~EUR43.9 million), an increase of around 14% when compared with 2012 estimates. The majority of value (92%) was derived from reptiles, predominantly Alligatoridae and Pythonidae; the remainder from mammals (predominantly Canidae and Felidae). Caviar exports were worth around USD32 million (~EUR29.4 million), slightly higher than in 2012 (just over USD30 million), with over 98% being from captive sources.
Live animals
Compared with the volume and value of EU live animals imported (around a million animals, worth around USD28 million), export volumes were much lower (447 000 animals), but overall value was estimated to be more than double (USD67.9 million, ~EUR62.3 million). The value of EU exports of live animals declined by around 25% based on 2012 estimates (USD90.3 million, corrected for inflation).
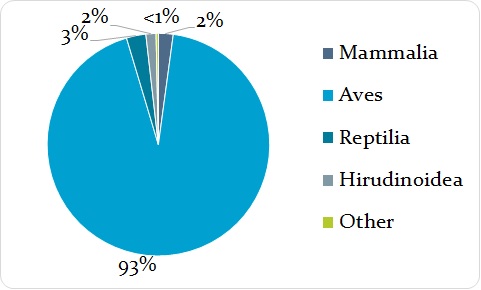
In contrast to EU live animal imports, export value was dominated by birds, as in 2012, with 93% of the overall value (USD63.3 million, ~EUR58 million) being attributed to this group (Figure 5.8). Live exports of reptiles were worth an estimated USD1.9 million ~EUR1.74 million). However, the value of exports of Hirudinoidea (leeches) declined based on 2012 estimates of approximately 11.8million (corrected for inflation), to just less than USD1 million in 2013.
Almost 133 000 live birds were exported from the EU in 2013. The approximate average value of a live bird (based on estimated family median values[2]) was around USD476 (Table 5.3). Virtually all of the value (>99%) involved captive-bred birds, with the main genera involved being Agapornis (30%) and Falco (15%). Agapornis spp. are non-native to the EU.
Belgium was the main exporter of live birds by overall estimated value in 2013 (34%), with the Netherlands also an important exporter (30% of value). The top importers by value were: Indonesia (34% or USD21 million), which was the main destination for Agapornis spp.; United Arab Emirates (23% or USD14 million), being the key importer for Falco spp.; and Israel, Jordan and Kuwait, each accounting for less than 6%.
Live mammal exports were estimated to be worth USD1.5 million (~EUR1.37 million) in 2013, having declined by approximately 30% from the 2012 estimate. In 2012, EU exports of live primate families were identified to be most valuable, however Felidae represented the most valuable live mammal export in 2013, with all exports being captive-bred. The main trading partner by estimated economic value was the Russian Federation (12%).
Exports of live reptiles from the EU in 2013 was estimated to be worth USD1.9 million (~EUR1.74 million), and increase of 25% based on 2012 estimates (USD1.52 million corrected). The key reptile families in order of estimated value were: Testudinidae (46%), Pythonidae (22%) and Chamaeleonidae (19%). The main EU trading partners by economic value for these three families respectively, were Hong Kong (SAR), Taiwan (Province of China), and the United States. The majority of the economic value in exported live reptiles was derived from captive-bred specimens (98%).
| Class | Average value in USD of live animals (reported in number) by class (using estimated median family values) | Approximate EUR equivalent |
|---|---|---|
| Mammalia | 1775 | 1626 |
| Aves | 476 | 436 |
| Reptilia | 56 | 51 |
| Amphibia | 34 | 31 |
| Arachnida | 8 | 7.3 |
| Hirudinoidea | 5 | 4.6 |
| Anthozoa | 5 | 4.6 |
| Bivalvia | 4 | 3.7 |
| Actinopterygii | 1 | 0.9 |
[1] Cotance, 2012. Social and Environmental Report – the European leather industry.
[2] Total 2013 (re-)export value by class, divided by the number of animals (re-)exported in 2013, by class.
Value of caviar extract
As for EU imports, caviar extract was also the main commodity exported from the EU by value in 2013, amounting to USD46.3 billion[1] (~EUR42.4 billion). The value of this commodity declined based on 2012 estimated values to reflect decreased volumes in trade (2400kg in 2013 compared with over 4100kg of this commodity exported in 2012). Captive-produced caviar extract is estimated to be worth USD19 million per kilogram according to United States Customs data, based on over 500 price records. Virtually all was captive-bred (>99.9%) and was predominantly exported by France. Switzerland and the United States were the main importers by value (53% and 21% respectively). Around two-thirds of the value of the exported caviar extract was derived from Acipenser baerii, which is native to China, Kazakhstan and the Russian Federation. Much of the remainder was derived from A. transmontanus, a species which occurs in North America.
Therefore, when caviar extract is included, the total value of CITES-listed animals and animal products exported by the EU in 2013 was estimated at USD47 billion (USD47 829 335 554 or ~EUR43 billion).
[1] Billion” in this report is used to refer to 109.
Value by exporter
Whilst all 28 Member States exported animal commodities in 2013, two countries (Italy and France) accounted for 74% of the overall estimated export value, excluding caviar extract. The majority of value from these exports was comprised of luxury goods such as leather products and garments. Trade in live animals was the most valuable commodity exported by the Netherlands and Belgium.
